Showing posts with label economics. Show all posts

Tuesday, June 1, 2010

Is R&D off-shoring killing us?

Richard Florida asks a few questions about R&D off-shoring trends in this post at theAtlantic.

TheRaven ran a quick test to gauge whether R&D off-shoring has caused measurable harm to the U.S. economy. The operative question is whether the economic subset associated with innovation is growing faster or slower than the labor market as a whole. Jobs associated with R&D should grow if the innovation process is out-pacing the economy and compensating for off-shoring. Conversely, if R&D employment is falling, then increased R&D off-shoring can be viewed as an existential threat, not the more benign balancing of national strengths in a global economy.

Bureau of Labor Statistics (BLS) occupation employment data was used to address this question. The BLS publishes pay range and employment data for a constant list of 800 occupations, each May. I have this data by 4-digit NAICS (North America Industry Classification System) code for 2005 through 2009. The BLS publishes data one year after it's initially collected, so, for example, the May 2010 database reports labor market conditions as of May 2009.

There are 47 occupations that can be reasonably associated with R&D - nearly all of the scientific and engineering occupations. Most people in these occupations are not devoted to R&D because R&D is typically just a few percentage points of an overall organization budget. There are exceptions, such as contract research firms, academic labs, etc., but we're dealing with occupation data across the U.S. economy. Looking at these 47 occupations should provide a decent proxy measure, especially given consideration of: (1)  labor market contraction between 2008 and 2009, and that (2) R&D is a well-known budget casualty in tough times.

Findings:

1. From 2005 through 2009:

a) The 18 science occupations had a +15% aggregate employment gain. Fourteen of 18 occupations had higher employment levels in 2009, vs. 2005.

b) The 29 engineering occupations had a +7% aggregate employment gain. Twenty-three of 29 occupations had higher employment levels in 2009, vs. 2005.

c) All 47 occupations had a +9% aggregate employment gain. Thirty-seven of 47 occupations had higher employment levels in 2009. The overall gain was 164,900 jobs.

2. Between 2008 and 2009:

a) The 18 science occupations had a +1.5% aggregate employment gain. Eleven of 18 occupations had higher employment levels in 2009, vs. 2008.

b) The 29 engineering occupations had a (1%) aggregate employment loss. Sixteen of 29 occupations had higher employment levels in 2009, vs. 2008.

c) All 47 occupations had (0.4%) aggregate employment loss. Twenty-seven of 47 occupations had higher employment levels in 2009, vs. 2008. The net loss was (8,370) jobs.

This group of occupations did better than the labor market as a whole over the 2005-2009 period and especially between 2008 and 2009. BLS data represents the bulk of the US labor market. The NAICS data-sets exclude only farming, domestic help and freelancers.

Click image to view full-size
Conclusion: while the labor market data is broad-brush, employment trends in occupations associated with R&D run counter to adverse macroeconomic circumstance and suggest that increased R&D off-shoring has not materially affected U.S. R&D-associated employment. Therefore, it's not likely that the off-shoring trend discussed in theAtlantic piece has inflicted meaningful harm on the U.S. economy.

PS - this look at employment trends and pay range patterns in four selected science occupations provides further information:

Thursday, May 20, 2010

Destiny

The Euro has been in the news lately and media attention has, as usual, focused on one factor in a multivariate situation. Greek sovereign debt is an issue but the Greek economy is so small that if it vanished tomorrow, Europe would forget, in macro-economic terms, by this weekend. The media uses European sovereign debt to explain the Euro crisis.

Hand-wringing now extends to Spain and Portugal. If sovereign debt itself were the core problem, Japan would have imploded decades ago. High sovereign debt is generally a self-solving problem so long as national economies continue on a reasonable growth trajectory (e.g., Japan, to-date). Therefore, the real issue is investor expectations regarding Europe's future growth.

Why are investors concerned?

Because demographics is destiny.
 
******************************************************
UPDATE: You can download the tool used to prepare charts in this post. The tool is stored on Docstoc, download it here. Zero Excel skills are needed. The tool is operated only with a mouse. Use it with Excel2007 or Excel2010. Do not attempt use with Excel2003. There's also a brief, illustrated walkthrough, a PDF document which can be downloaded here.
******************************************************
Using historic and projected population data from the UN, we begin with a look at world population trends between 1950 and 2050.

Click image to see full size
The UN data covers 196 countries. Between now and 2050, the UN Population Division projects that:

* Average life expectancy will increase 10%, from 69 to 76 years
* Global population will increase one-third, from 7.0 to 9.5 billion people
* Median age will increase one-third, from 29 to 39 years
* Fertility will fall 20%, 2.5 to 2.0 births per woman
* The ratio of persons aged 15-64 years old to total population, the broadly-defined productive population ratio, will fall from 64% to 61%.

Except for exacerbation of climate change caused by a one-third increase in human population and continued, out-sized growth in the global middle-class, this global picture is fairly benign. It should be noted that increasing life expectancy, not birth rate, now drives population growth. Current macro-economic concerns are driven by how the global picture breaks down between regions and countries.

Asia, North America and Latin America do not materially deviate from global averages. However, comparison between Africa and Europe helps to define Europe's emerging demographic crisis. Europe and Africa have been headed in opposite demographic directions for decades. We begin with Africa:

Click image to see full size
 Africa forecast:

* Average life expectancy will increase 21%, from 56 to 68 years
* Population will double, from 1.0 to 2.0 billion people (in only two generations!)
* Median age will increase 45%, from 20 to 29 years
* Fertility will fall by half, from  4.7 to 2.4 births per woman
* The productive population ratio will leap from 56% to 65%.

Developed economies have enjoyed productive population ratios that cluster around 65% since 1950. Japan had the highest ratio in 1970 (69%) and peaked 20 years later at 70%. Japan's productive population ratio is now 64%. The U.S. is a model of consistency, compared to other nations. Our ratio remains in a fairly tight  61% to 67% range over 1950-2050.

History suggests that the productive population ratio dividing line between growing vs. stagnant economies is about 60%. The Africa forecast suggests that with establishment of genuine governance and rule of law, Africa's improving demographics could finally propel it out of poverty.

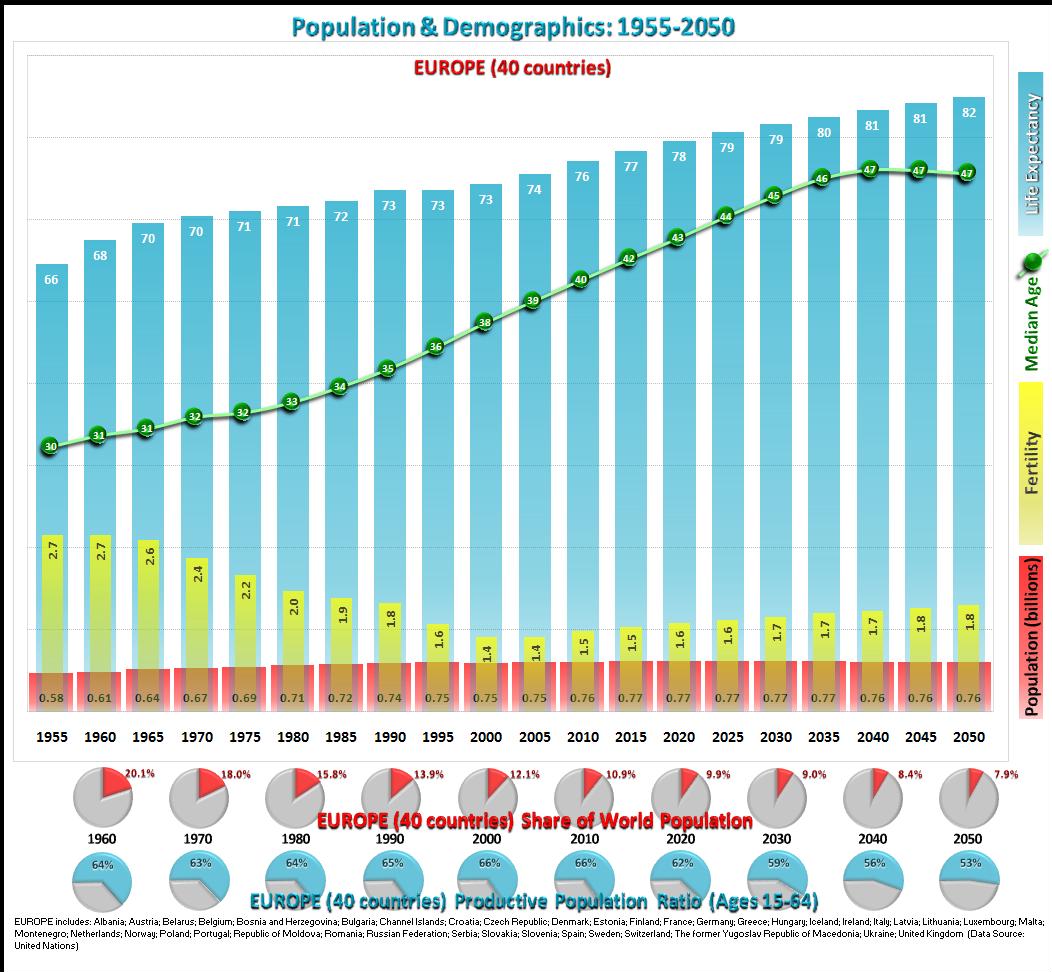
We now look at Europe:

Click image to see full size
Europe forecast:

* Average life expectancy will increase 8%, from 76 to 82 years
* Population remains stuck at 760 million
* Median age will increase 18%, from 40 to 47 years
* Fertility will rise, from  1.5 to 1.8 births per woman
* The productive population ratio will drop from 66% to 53%.


In 1950, Europe accounted for 20% of global population while Africa comprised 8%. By 2050, these positions will be reversed. Europe's fertility has been below replacement rate since 1980 and is forecast to remain below replacement rate up to 2050. Europe's current life expectancy exceeds Africa's forecast improvement, 40 years hence, by 10%.

Europe faces an epic demographic crisis. Its productive population ratio is forecast to fall one-fifth over the next 40 years. With the exception of the UK, European countries lack immigration policies rooted in demographic reality. By retaining the Pound instead of adopting the Euro the UK effectively monetized its (comparatively) progressive immigration policy. Brilliant!

Let's look at where the European demographic forecast is most adverse, the 12 countries in UN's definition of "Southern Europe":

Click image to see full size
Southern Europe forecast:

* Average life expectancy will increase 5%, from 80 to 84 years
* Population will slightly increase, to 170 million
* Median age will increase 20%, from 41 to 49 years
* Fertility will rise, from  1.4 to 1.8 births per woman
* The productive population ratio will plummet, from 64% to 49% (a 23% decline in ratio)

Compared European averages, Southern Europe is already older, living longer, with lower birth rate and proportionately less productive population. The forecast calls for these demographic differences to get worse. Southern Europe includes Greece, Portugal and Spain. The region also includes Italy, whose demographic crisis has sparked fertility incentives from a few local governments. Southern Europe's productive population ratio is forecast to fall by almost one-quarter.

Why will a steep drop in productive population ratio kill growth in developed nations? Won't technological advances improve productivity in the remaining workforce? While the answer to the 2nd question is "most likely" the answer to the first is "because you must also consider life expectancy". The short answer to the first question is "because taxes will rise".

The flip-side of Southern Europe's 23% fall in productive population ratio is that the unproductive population ratio will jump 42%. Compare this to Africa, where the unproductive population ratio will decline by 20%.  In a macroeconomic context, demographics is truly a two-edged sword. European governments, particularly in Southern Europe, will raise taxes in future to support an exploding old-age population. An average life expectancy of 84 translates to a minimum of 20 unproductive years for each healthy person.

By missing the bigger issue the media has also missed the most likely next big debt crisis. The only developed country in worse demographic shape than Europe is the 2nd largest economy on the planet. Japan's productive population ratio is forecast to fall to 51% by 2050 as its already-stellar life expectancy climbs to 87 years. Deflation already casts a pall over expectations for the Japanese economy.

This analysis also explains why a seeming turnaround in attitude regarding the dollar is really no surprise. The U.S. will get older, its productive population ratio will fall and taxes will rise but the real issue is the relative magnitude of these trends. Total U.S. population will increase one-third over the next 40 years and the productive population ratio will remain above 60%. It turns out that being a nation of immigrants is both a moral cause and a saving grace.

(All analysis by TheRaven).

Sunday, April 18, 2010

Proximate Cause

Governor McDonnell's pronouncement of Confederate History Month deserves unending scorn because he pandered to the Sons of Confederate Veterans and other groups that are akin to holocaust deniers. His proclamation skipped over slavery as the underlying cause for war and was clearly aimed at a largely uneducated white majority. McDonell's outrage renders his subsequent apology unworthy of consideration.

Perpetrators of the great southern lie - for it is only in the south that we find those who trade in the "War of Northern Aggression" and related nonsense - suspend disbelief to argue every possible excuse. They either lack critical thinking skills or, blinded by other dogmas such as biblical literalism, suppress the very skills that serve their professional life to propagate coded racism. An example of "educated denialism" is synopsized here...http://georgiaheritagecouncil.org/site2/commentary/scruggs-causes-uncivil-war030607.phtml and background on the author (Mike Scruggs) can be found here..http://www.markwhiteusa.com/AboutUs.html.

There were many proximate causes of the Civil War and each one is threaded to one, and only one, central issue. The proof is a simple question: if slavery had not existed, would there have been a war? Among all proximate causes, my two favorites are: weak Federal treasury, exemplified by lack of a national currency; the out-sized influence of abolitionists on northern politics. The premise for the importance of these two factors is: the inseparability of slave labor with the southern economy; and, another simple question: what other country had a slavery problem, and how was it solved?

The central problem leading up to the war was political paralysis. The underlying disease was slavery. This is a cautionary tale for our current climate of instant polarization. Abolitionists succeeded in painting slavery with a brush dipped in pure moral tones. Southerners heard a quite different message. Slaves were not only the source of most southern income; they also comprised its largest asset class. Slaves were so important to the southern economy that an insurance market sprang up around them (http://www.insurance.ca.gov/0100-consumers/0300...). The southern ruling class heard a moral position and responded in kind, giving birth to the great southern lie.


The intractability of issue becomes clear if you consider how possible loss of slave capital was perceived to also imperil other forms of capital, such as the value of plantations, and that the southern ruling class was diametrically opposed to free labor. About the only thing more distasteful than the risk of losing slave capital was the notion of an empowered class of previously servile, poor whites. The southern ruling class viewed possible loss of virtually all of their capital and income through an narrow ideological prism. Proof of their pre-war view is found in their post-Reconstruction behavior. The slave economy was re-established in all but name and majority of whites lived the same disadvantaged existence as before the war.

In hindsight, Federal purchase and emancipation of southern slaves might have been a viable alternative. The southern ruling class would have lost their primary motivation to fight (loss of capital) and then, forced to negotiate on less ideological ground, the north would have been in better position to leverage southern white underclass resentment into a political force. Reasons why this couldn't happen include abolitionist success in framing the northern argument and a weak Federal treasury. It was the Civil War that enabled (or forced) creation of our national currency.

This isn't an exercise in "presentism". Northern politicians had a fresh example for possibly preempting war with purchase/emancipation. A successful national government program to do exactly that was concluded 20 years before South Carolina initiated hostilities. The British parliament passed the Slavery Abolition Act in 1833. The Act provided terms of government purchase for all slaves in Britain, but not in all British possessions. The British government funded a seven year purchase/emancipation with 20 million pounds. The Act took effect in 1834 and by 1841 slavery in Britain was history.

The two core differences in Britain's experience were: (1) acceptance of slavery's economic reality, as opposed to polarizing moral arguments; (2) a strong government treasury. The counter argument to this view is that slavery was less important to the British economy than it was in the American south. That's true and is illustrated by the Act's limitations. However, such view does not consider how a similar solution could have been adopted in America with, for example, a longer emancipation period. Plus, 20 million pounds wasn't exactly chump change in 1833. The British program shows that war wasn't necessarily a foregone conclusion.

In fairness to the reason why historic inquiry is so important, the "moral vs. economic" argument should also be studied in context of northern culture and subsequent events. With very few exceptions, Abolitionists were racist. Northern blacks were an intensely segregated northern minority and the notion of free blacks possibly moving north was an anathema to the northern majority. This was the period also characterized by intense animosity towards Irish immigrants. Fifty-two years after Appomattox, The Great War caused an unprecedented labor market vacuum that accelerated the Great Migration. White reaction in northern (or non-southern) states to growing black population mirrored southern atrocities. One can argue the southern-ness of Tulsa but few would call Detroit anything but northern.

The "moral vs. economic" argument is useful for widening the debate. It does not posit an alternative past in which peace could have been simply bought with a fat cheque. It does argue for complete inquiry, with all truths dragged into the light of day. Exploration of northern culture would provide necessary balance, however, the final conclusion would remain inescapable.

Slavery caused the war.

Dismal Science


Climate scientists only have themselves to blame for the growing denialist cacophony. The recent flap over climate data isn’t the reason. Rather, failure to invite economists to the climate party has left solution advocates bereft of their best possible weapon. Paul Krugman’s recent piece in the Times Sunday Magazine is hardly an auspicious entre. He hews to cap ‘n trade dogma in tones of a grade-school lecture. We’d do better if Cap ‘n Crunch led the fight. America’s fear of foreigners is ripe for exploitation towards development of exportable, carbon-free technologies.
 
From the beginning of the Holocene to 1950, the human population grew from close-to-nothing to 2.5 billion. From 1950 to 2050 - a mere 100 years (a geological eye-blink) - human population will grow at least another 6.5 billion people. Since global population is now 6.8 billion, it is virtually certain that 2050 will see 9+ billion people.
 
Along this time line we've seen an explosion of capitalism that spawned the biggest prosperity surge in human history. Every person on the planet who experiences a rising living standard uses more carbon. For example, meat is the first item purchased in larger quantities. You can't blame people for wanting to better feed their children. The big news is that most of world is just beginning to ramp up their carbon output.
 
China passed the US in total carbon emissions 2 years ago, yet China's per-capita GDP is only one-eighth the US (in purchasing power parity). India is much further back, with per-capita GDP less than one-half of China's and 800 million people (2.6 times the US population) living in poverty. What do you think happens when billions of poor people just slightly improve their living standard? Now consider what happens when the global middle class adds 2 billion people (7 times US population) over the next 20 years.
 
Global annual CO2 increase fell one-third in the early-90s recession. The current recession - which is far worse - hasn't dented CO2 output. Not a freaking scratch! The developing world is already driving the CO2 bus for a simple reason: developed nations account for only 10% of global population. The pace of global annual CO2 output has more than doubled over the past 50 years. Funnily enough, human population doubled over the same period.
 
We’re going to add a similar number of people over the next 40 years and they, along with most people already living, will become progressively larger consumers of carbon-based processes, like making electricity or growing beef. There are many things climate change denialists don't consider. My favorite is the global explosion in consumer finance. Twenty years ago you couldn't finance a motorcycle in Vietnam, get a mortgage in Brazil or get personal credit in Indonesia. While China gets all the bad press for air pollution, completed its national highway system ~10 years ahead of schedule and bought more new cars last year than we did (for the first time), replacement of bicycles with motorcycles in Hanoi (BTW, Vietnam has the same population as Germany), a Brazilian housing boom and Indonesian economic growth sparked by consumer credit are overlooked.
 
It isn’t us anymore. CO2 growth is global, rapidly-accelerating and apparently unstoppable. China's economy will double every 9 years at trend-line growth rates and India's will double every twelve. China offered a vague 20% carbon reduction at the last climate meeting. Do the math on the net increase in carbon output over the next 9 years. The last time CO2 was at present levels (388ppm), there was less global ice, seas were higher, northern Canada was a temperate forest and reptiles were a lot bigger. The blindingly simple truth about climate change is that: CO2 is a leading indicator; average temperature lags behind CO2; sea level lags behind temperature. Given population growth, the global prosperity explosion and CO2 levels that were last seen 30 million years ago, why is anyone surprised by rising temperatures and melting ice?
 
The funny thing about climate change denialists is that free market signals on climate change reality show up in many of their mailboxes, as higher insurance premiums or notices of canceled coverage. Liberty Mutual, Allstate, StateFarm & others have either walked away from lucrative markets, exponentially increased premiums, red-lined coastal markets, gotten in fights with state regulators or all of the above. You'd expect to see the first free market signals on climate change from the property insurance industry. If it was mere corporate greed major insurers wouldn't be walking away from billions of premium dollars. Last year, an insurance industry association publicly issued a recommendation that its members should measure and disclose climate change risk. Yet another unmistakable signal that the dismal science matters most to acceptance of climate change solutions.
 

Data sources: NOAA, CIA World Factbook, TheEconomist; UN; US Census Bureau

UPDATE (July 5, 2010) - The New york Times finally gets a clue. This article says "...even as Beijing imposes the world’s most rigorous national energy campaign, the effort is being overwhelmed by the billionfold demands of Chinese consumers". Even though TheRaven predicted growth in global consumer demand would outrun the transition from carbon-based energy, The Times projection of China's CO2 output is shocking.
UPDATE (August 5, 2010) - the New York Times gets another clue with tolerable reporting on political stability, fast growth and emergence of a consumer society in the worlds 4th largest country and 3rd largest democracy. Pay no heed to descriptions of Indonesia as a "Muslim country". Indonesia is a pluralist democracy in which religion plays a similar role to American Christianity. THe artcile deosn't mention climate change but you can connect the dots.