Showing posts with label media. Show all posts

Friday, May 28, 2010

Send flowers

The Bureau of Labor Statistics (BLS) publishes occupation pay and employment data in May of each year. The data is "as-of" May of the preceding year, since the BLS needs a year to vet data, which covers pay range and employment for 800 occupations in 400 metro areas and 291 industries. Occupations are defined by the BLS while industries are defined using the North America Industry Classification System (NAICS). This post covers changes in employment by industry from 2005 to 2009.

TheRaven has summarized occupation-by-industry data into broadly defined industry groups. Groupings attempt to vertically align industries according to basic economic themes. To be clear, the data is authoritative and covers the entire U.S. workforce, except for farming; domestic help and freelancers. Bearing in mind that industries overlap and that no grouping system is perfect, this post uses summarized BLS data to throw light on a few aspects of the US job market not found in typical reportage.  

Click any chart to see it full-size.

Reported: bankruptcies of GM and Chrysler, loss of Big-3 jobs.
Missed: the Big-3 workforce is a very small piece of total auto industry employment. Due to Big-3 outsourcing and inroads by Toyota, Honda, Subaru, Hyundai, et al, component manufacturers employ the bulk of the auto manufacturing workforce and they took the brunt of layoffs. Big-3 employees got the ink but lesser-known, lower-paid people felt the pain.

Confused by the chart? 

Left side - employment by industry, by year.
Center - color codes (chart legend)

  Important: color code sequence matches left & right, reading from top to bottom.

Right side - percentage distribution of employment, by industry, by year.

Reported: individual retailers struggled during the recession, retail layoffs, Las Vegas implosion.
Missed:
1) Florists have fared worse than the gambling industry, with a (25%) employment drop vs. (23%) in gambling.
2) "General merchandise stores" employment is up 29% over 2005, with 2009 gaining 3%.

Reported: oil prices, gas prices, "pain at the pump", "drill baby, drill", coal mine disasters, West Virginia's eternal dependence on coal, rising atmospheric carbon, climate change, oil spills.

Missed: employment in core industries of the carbon-based economy has been slowly falling, even as oil & gas exploration ramped up, and these industries account for less than 2% of the U.S. workforce.

Reported: "bailouts", tea bagger rage at the Federal government, flourishing conspiracy theories and extremist groups, "bloated Federal bureaucracy", slow dispersal of stimulus money.

Missed:
1) State & local governments employ four-times more people than the Federal government.
2) 87% of new government jobs created by the 2009 hiring surge were State & local.
3) all government jobs in 2009 accounted for only a slightly larger share of the U.S. workforce as compared to 2005.

Reported: anything branded "Apple", every Intel press release, lawsuits, video game releases, all "smart" objects, including the stupid ones.

Missed:
1) U.S. electronic manufacturing in long-term decline.
2) Digital economy jobs are up almost 10% over 2005, even after a 2% dip in 2009.
3) Systems design is flourishing.

Reported: newspaper financial trouble, Leno vs. Conan, Lost, 24.

Missed:
1) Old-media industries are in an across-the-board, long-term decline (it's not just newspapers).
2) Industry group share of U.S. workforce fell from 2.2% to 1.9%.
3) Internet-driven creative destruction is hitting in-force (aided by journalist incompetence).

Reported: organic vs. non-organic, Michael Pollan, franchise restaurant financial trouble, farming efficiencies have reduced farm employment to a tiny fraction of the U.S. workforce.

Missed:
1) Industry employment ratios from 3-4 generations ago have reversed. Where once a vast number of farmers produced food that moved through thinly-staffed distribution, a comparatively tiny farming workforce now plugs into a vast distribution network.
2) Where 3-4 generations ago very few people ate out, America now has a huge, sophisticated set of restaurant industries that have significantly displaced meals at home.
3) Almost one-in-eight U.S. workers is connected to food and this industry grouping shows a 3.8% net gain over 2005 employment, after shedding 177,980 jobs in 2009.

Reported: so-called Obama-care, so-called town-hall meetings, health-care share of GDP, hospitals feeling effects of uninsured population

Missed:
1) Hospitals & outpatient centers account for more than one-third of health care employment.
2) While hospital employment grew 7% between 2005 and 2009, ambulatory/outpatient industries grew a (combined) 18%.
3) Home care had the fastest employment growth, increasing by one-quarter between 2005 and 2009.

Reported: collapsing real estate markets, over-building, death of the suburbs, Case-Schiller, home buyer credits, foreclosures, short sales, home builder financial issues, mass layoffs.

Missed:
1) Similar to the auto industry, collapse of home building rippled through many supplier industries.
2) One-in-eight jobs related to home construction was lost with most of the decline in 2009.
3) This industry group dropped from 8.0% to 6.9% of the U.S. workforce.

Reported: "off-shoring", jobs lost to overseas competition, "no job safe".

Missed:
1) Domestic out-sourcing industries are an immense group, accounting for 1-in-9 U.S. jobs.
2) In 2009, this industry group gave up almost all the 1+ million jobs it gained over 2005-2008.
3) Employment services were crushed, losing 1 million jobs between 2007 and 2009.

****************************************

A subsequent post may look at more winners & losers among individual industries and occupations. This was the introductory, top-level view.

(All analysis by TheRaven)

Thursday, May 20, 2010

Destiny

The Euro has been in the news lately and media attention has, as usual, focused on one factor in a multivariate situation. Greek sovereign debt is an issue but the Greek economy is so small that if it vanished tomorrow, Europe would forget, in macro-economic terms, by this weekend. The media uses European sovereign debt to explain the Euro crisis.

Hand-wringing now extends to Spain and Portugal. If sovereign debt itself were the core problem, Japan would have imploded decades ago. High sovereign debt is generally a self-solving problem so long as national economies continue on a reasonable growth trajectory (e.g., Japan, to-date). Therefore, the real issue is investor expectations regarding Europe's future growth.

Why are investors concerned?

Because demographics is destiny.
 
******************************************************
UPDATE: You can download the tool used to prepare charts in this post. The tool is stored on Docstoc, download it here. Zero Excel skills are needed. The tool is operated only with a mouse. Use it with Excel2007 or Excel2010. Do not attempt use with Excel2003. There's also a brief, illustrated walkthrough, a PDF document which can be downloaded here.
******************************************************
Using historic and projected population data from the UN, we begin with a look at world population trends between 1950 and 2050.

Click image to see full size
The UN data covers 196 countries. Between now and 2050, the UN Population Division projects that:

* Average life expectancy will increase 10%, from 69 to 76 years
* Global population will increase one-third, from 7.0 to 9.5 billion people
* Median age will increase one-third, from 29 to 39 years
* Fertility will fall 20%, 2.5 to 2.0 births per woman
* The ratio of persons aged 15-64 years old to total population, the broadly-defined productive population ratio, will fall from 64% to 61%.

Except for exacerbation of climate change caused by a one-third increase in human population and continued, out-sized growth in the global middle-class, this global picture is fairly benign. It should be noted that increasing life expectancy, not birth rate, now drives population growth. Current macro-economic concerns are driven by how the global picture breaks down between regions and countries.

Asia, North America and Latin America do not materially deviate from global averages. However, comparison between Africa and Europe helps to define Europe's emerging demographic crisis. Europe and Africa have been headed in opposite demographic directions for decades. We begin with Africa:

Click image to see full size
 Africa forecast:

* Average life expectancy will increase 21%, from 56 to 68 years
* Population will double, from 1.0 to 2.0 billion people (in only two generations!)
* Median age will increase 45%, from 20 to 29 years
* Fertility will fall by half, from  4.7 to 2.4 births per woman
* The productive population ratio will leap from 56% to 65%.

Developed economies have enjoyed productive population ratios that cluster around 65% since 1950. Japan had the highest ratio in 1970 (69%) and peaked 20 years later at 70%. Japan's productive population ratio is now 64%. The U.S. is a model of consistency, compared to other nations. Our ratio remains in a fairly tight  61% to 67% range over 1950-2050.

History suggests that the productive population ratio dividing line between growing vs. stagnant economies is about 60%. The Africa forecast suggests that with establishment of genuine governance and rule of law, Africa's improving demographics could finally propel it out of poverty.


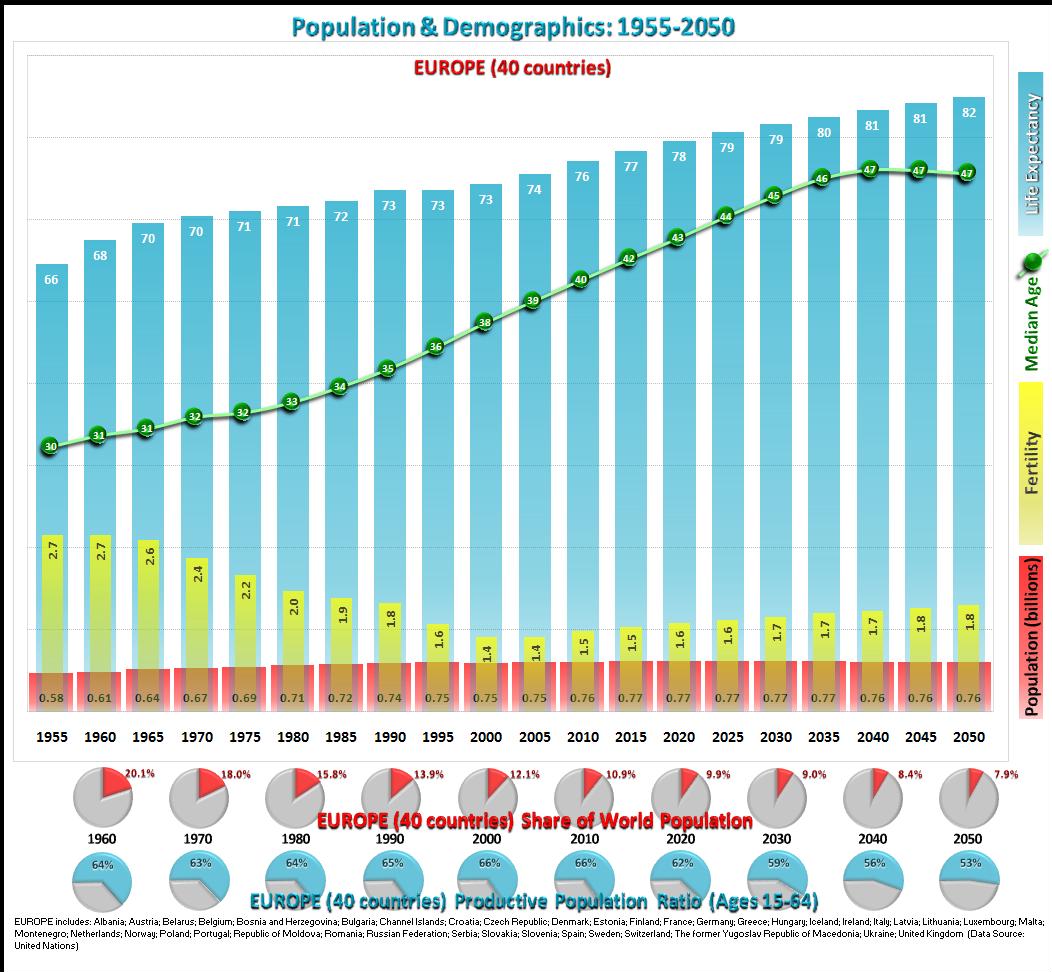
We now look at Europe:

Click image to see full size
Europe forecast:

* Average life expectancy will increase 8%, from 76 to 82 years
* Population remains stuck at 760 million
* Median age will increase 18%, from 40 to 47 years
* Fertility will rise, from  1.5 to 1.8 births per woman
* The productive population ratio will drop from 66% to 53%.


In 1950, Europe accounted for 20% of global population while Africa comprised 8%. By 2050, these positions will be reversed. Europe's fertility has been below replacement rate since 1980 and is forecast to remain below replacement rate up to 2050. Europe's current life expectancy exceeds Africa's forecast improvement, 40 years hence, by 10%.

Europe faces an epic demographic crisis. Its productive population ratio is forecast to fall one-fifth over the next 40 years. With the exception of the UK, European countries lack immigration policies rooted in demographic reality. By retaining the Pound instead of adopting the Euro the UK effectively monetized its (comparatively) progressive immigration policy. Brilliant!

Let's look at where the European demographic forecast is most adverse, the 12 countries in UN's definition of "Southern Europe":

Click image to see full size
Southern Europe forecast:

* Average life expectancy will increase 5%, from 80 to 84 years
* Population will slightly increase, to 170 million
* Median age will increase 20%, from 41 to 49 years
* Fertility will rise, from  1.4 to 1.8 births per woman
* The productive population ratio will plummet, from 64% to 49% (a 23% decline in ratio)

Compared European averages, Southern Europe is already older, living longer, with lower birth rate and proportionately less productive population. The forecast calls for these demographic differences to get worse. Southern Europe includes Greece, Portugal and Spain. The region also includes Italy, whose demographic crisis has sparked fertility incentives from a few local governments. Southern Europe's productive population ratio is forecast to fall by almost one-quarter.

Why will a steep drop in productive population ratio kill growth in developed nations? Won't technological advances improve productivity in the remaining workforce? While the answer to the 2nd question is "most likely" the answer to the first is "because you must also consider life expectancy". The short answer to the first question is "because taxes will rise".

The flip-side of Southern Europe's 23% fall in productive population ratio is that the unproductive population ratio will jump 42%. Compare this to Africa, where the unproductive population ratio will decline by 20%.  In a macroeconomic context, demographics is truly a two-edged sword. European governments, particularly in Southern Europe, will raise taxes in future to support an exploding old-age population. An average life expectancy of 84 translates to a minimum of 20 unproductive years for each healthy person.

By missing the bigger issue the media has also missed the most likely next big debt crisis. The only developed country in worse demographic shape than Europe is the 2nd largest economy on the planet. Japan's productive population ratio is forecast to fall to 51% by 2050 as its already-stellar life expectancy climbs to 87 years. Deflation already casts a pall over expectations for the Japanese economy.

This analysis also explains why a seeming turnaround in attitude regarding the dollar is really no surprise. The U.S. will get older, its productive population ratio will fall and taxes will rise but the real issue is the relative magnitude of these trends. Total U.S. population will increase one-third over the next 40 years and the productive population ratio will remain above 60%. It turns out that being a nation of immigrants is both a moral cause and a saving grace.

(All analysis by TheRaven).