Showing posts with label rising seas. Show all posts

Wednesday, November 10, 2010

CO2 increase records, in context

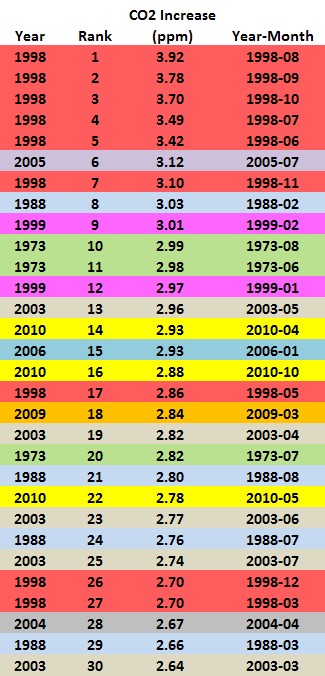
Just in case the last four posts went by too quickly, this post puts the Top-30 increases over 52 years of Muana Loa data in context. Let's begin with a look at the Top-30.


You might be thinking that TheRaven's Mega Melt Enthusiasm is misplaced. Where's the evidence that we face impending acceleration of global temperature increase, melting ice and rising seas? The Top-30 list helps discern some patterns.

Each year in the list is color-coded. This makes it easy to see that 1998 contributed more Top-30 records than any other year. Also, note that the magnitude of CO2 increase in the Top-30 ranges from 2.64ppm up to 3.92ppm. Those increases are +30% to almost 2-times their respective trailing, 5-year averages. Given the concentration of Top-30 jumps in CO-2 over the past dozen years, this is evidence of ongoing trend acceleration.

Said concentration, over the past dozen years, is a bit less obvious. This summary improves clarity.


Top-30 records have been created in only ten years (out of 52). Twenty-three records (3/4th's) have occurred in over just the past dozen years and, thus far, 2010 is the 5th-most productive year on record. While 2010 won't deliver the future-shock awesomeness of 1998, I've got high hopes for 2011. Given population and economic growth that's occurred since 1998, ongoing recovery in the world economy and comparatively greater limitations in Earth's ability to absorb atmospheric carbon,  I'm looking at 2011 pretty much as the Cowboys view it. TheRaven and the Cowboys both say....

Wait 'til next year!

This is more like it!

October sure restored TheRaven's Mega-Melt Enthusiasm!

As you might recall, April set a new all-time record and May nearly set another one. This promising one-two punch was followed by solid but, quite frankly, unspectacular CO2 growth in June through September.

Hello, October!

CO2 jumped an impressive +2.88ppm over October 2009, the second-highest October increase in the history of Muana Loa data! Perhaps equally impressive, October 2010 recorded the 16th highest annual increase of any month over the past 52 years.

If global ice melt were the Olympics, 2010 has shaped up as a fairly decent year. In the harbinger competition, 2010 has won a gold (April),a silver (October) and a bronze (May). We'll just overlook the disappointing stretch from June through September.

Your Mega-Melt Enthusiast is back, with a vengeance!

Nothing to get enthusiastic about

Picking up where the prior post left off, we turn to August 2010 CO2.

August 2010 saw a +2.23ppm gain vs. August 2009. This increase is somewhat above trailing 5-year average annual increase, but far outside the Top-30 increases in the entire Muana Loa data set.

Mega-Melt Enthusiasm will have to sit on ice, waiting for September.

Meanwhile, here's August:

Mega Melt Enthusiast

CO2 isn't the only made-man agent of ice destruction, but NOAA's Muana Loa observatory has been recording and publishing monthly CO2 levels since 1958. That's a great data set for advancing my new role as a ....

Mega-Melt Enthusiast!

We're not talking about some fast food concoction. Nope, this is the real deal, the defining event of the 21st century, unfolding in real time for everyone but our elected Republican politicians. TheRaven says: stop worrying about government gridlock and embrace the rising seas.

CO2 levels are simply the harbinger of the inexorable loss of all surface ice. Rising temperatures follow rising CO2 and rising seas follow rising temps. CO2 hasn't been this high in the past 15-30 million years and, when it was, Earth was much warmer, there was very little surface ice and Hollywood didn't need CGI to conjure up gigantic reptiles.

It's possible that CO2 has never risen so much in such a short time span, except for that unfortunate accident 65 million years ago that ended the careers of a few dinosaurs.This blog is a guide to your future. Enjoy the ride.

***********************************************

TheRaven has a bit of catching up to do. This post will cover July 2010 and the next three will bring us current with October. You know the drill: CO2 levels rise in summer and fall in winter. This isolating cycle has marched steadily higher for the past 50+ years and has greatly accelerated over the same period. The rate of average annual increase roughly tripled between 1960 and 2000. The Great American Banking Disaster, which put the developed world's economy into a tailspin,  didn't put a scratch in CO2 growth. 

TheRaven is on an enthusiastic hunt for new monthly records, defined as new highs in year-over-year CO2 growth. Sadly, July was a disappointment. July 2010 saw +2.29ppm CO2 increase vs. July 2009. This puts July 2010 pretty far outside the Top-30 increases seen over the entire data series. The July 2010 increase was modestly higher than trailing 5-year average.